Plotting in python
Contents
Plotting in python#
Adding text to figures
Saving figures with different formats, sizes, and resolutions
Subplotting
import matplotlib.pyplot as plt
import numpy as np
%matplotlib inline
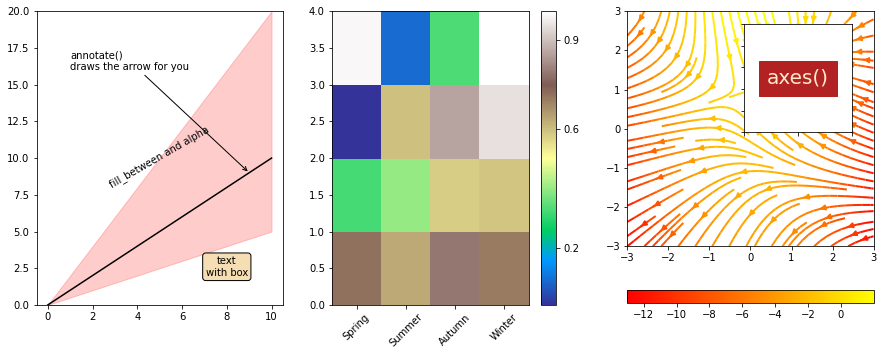
fig = plt.figure(figsize=(15, 6))
# Left subplot
ax1 = fig.add_subplot(131) #why 131?
x = np.linspace(0, 10, 100) # Makes an array with 100 elements between 0 and 10
ax1.plot(x, x, color='black')
ax1.fill_between(x, 2.*x, 0.5*x, color='red', alpha=0.2)
ax1.text(5, 8, 'fill_between and alpha', rotation=30, ha='center')
ax1.text(8, 2, 'text\nwith box', ha='center',
bbox=dict(boxstyle='round', facecolor='wheat'))
ax1.annotate('annotate()\ndraws the arrow for you', xy=(9, 9), xytext=(1, 16),
arrowprops=dict(facecolor='black', arrowstyle='->'))
ax1.set_ylim(0, 20)
# Middle subplot
ax2 = fig.add_subplot(132)
pcolor_data = np.random.rand(4, 4)
pcolor_map = ax2.pcolor(pcolor_data, cmap='terrain')
labels = ['Spring', 'Summer', 'Autumn', 'Winter']
xlabels = [0.5, 1.5, 2.5, 3.5]
plt.xticks(xlabels, labels, rotation=45)
fig.colorbar(pcolor_map, ax=ax2, fraction=0.15, ticks=[0.2, 0.6, 0.9])
# Right subplot from gallery example
ax3 = fig.add_subplot(133)
Y, X = np.mgrid[-3:3:100j, -3:3:100j]
U = -1 - X**2 + Y
V = 1 + X - Y**2
speed = np.sqrt(U*U + V*V)
plt.streamplot(X, Y, U, V, color=U, linewidth=2, cmap='autumn')
plt.colorbar(orientation='horizontal', fraction=0.05)
# Inset on right subplot
ax4 = plt.axes([0.78, 0.6, 0.1, 0.25])
ax4.text(0.5, 0.5, 'axes()', backgroundcolor='firebrick', color='blanchedalmond',
ha='center', va='center', fontsize=20)
plt.setp(ax4.get_xticklabels(), visible=False)
plt.setp(ax4.get_yticklabels(), visible=False)
# Move subplots up from bottom and save
plt.subplots_adjust(bottom=0.2)
plt.savefig('ExampleFigure1.png', dpi=200)
#plt.savefig('ExampleFigure1.tiff', dpi=50)
#plt.savefig('ExampleFigure1.svg')
On subplotting#
There are a few different options for making subplots with matplotlib. Once you are comfortable with add_subplot, you might want to try using a more complicated grid setup.
Recommendation: Make the figure first, then add subplots either individually or all at once in a grid#
The figure should have its own handle, e.g., the ‘fig’ in fig=plt.figure(), so that you can play with the size and save the figure without having to muck with anything else. You also want a handle for each subplot, e.g., ax1 = plt.add_subplot(211), so that you can do stuff to each of them, group and loop through them, and easily switch around between different axes (subplots). You can switch which axis matplotlib plotting commands work on with the set current axis command, matplotlib.sca(ax=axis_handle).
Options for adding subplots#
subplot() and add_subplot()
Probably most like what you might be used to from Matlab, but also doesn’t give you as much control as some other options. You specify the grid you want by putting numbers in parentheses. The default plotting command is equivalent to subplot(111), making a 1x1 grid of subplots and plotting in axis 1.subplot2grid
like subplot but uses 0-based indexing, a slightly more complicated input system (example below), and lets the subplot occupy multiple cells.axes
Adds an axis at a specific location. This is probably what you want for making a small subplot within the contour of a map or other figure, although it can get tricky if that larger figure is already a subplot.subplots (plural)
Quickly creates a grid of subplots with axis handles and gives you a little bit more control than in singular subplot.Additional control over spacing and layout are available with gridspec and subplots_adjust. tight_layout is also good to know about.
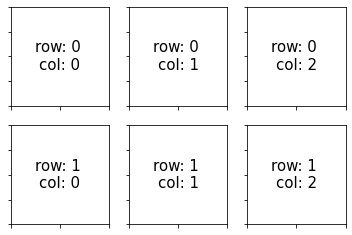
An illustration of subplot2grid#
Try playing with the number of columns (ncol) and rows (nrow)
fig2 = plt.figure()
ncol = 3
nrow = 2
for col in range(ncol):
    for row in range(nrow):
        # Each pass through this loop adds a new subplot
        ax = plt.subplot2grid((nrow,ncol),(row, col))
        string = ' '.join(('row:', '{:.0f}'.format(row),
                           '\ncol:', '{:.0f}'.format(col)))
        ax.text(0.5, 0.5, string, ha='center', va='center', fontsize=15)
        plt.setp(ax.get_xticklabels(), visible=False)
        plt.setp(ax.get_yticklabels(), visible=False)
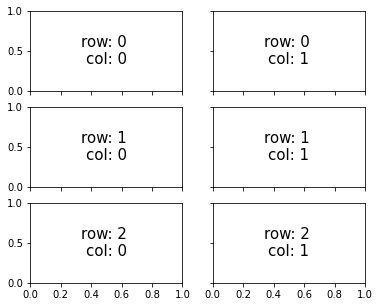
An illustration of subplots() and setting figure size after making the figure#
nrow = 3
ncol = 2

fig, axarr = plt.subplots(nrow, ncol, sharex='col', sharey='row')
fig.set_size_inches(6., 5.)

for col in range(ncol):
    for row in range(nrow):
        string = ' '.join(('row:', '{:.0f}'.format(row),
                           '\ncol:', '{:.0f}'.format(col)))
        axarr[row, col].text(0.5, 0.5, string, ha='center', va='center',
                            fontsize=15)
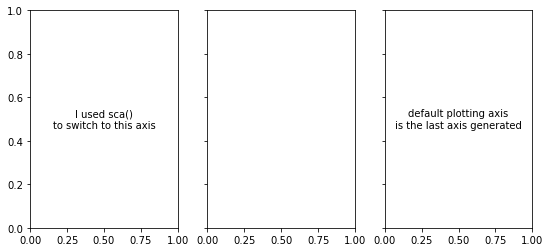
Set current axis example#
fig, (ax1, ax2, ax3) = plt.subplots(1, 3, sharey=True)
fig.set_size_inches(9, 4)

plt.text(0.5, 0.5, 'default plotting axis\nis the last axis generated', ha='center', va='center')

plt.sca(ax=ax1)
plt.text(0.5, 0.5, 'I used sca()\nto switch to this axis', ha='center', va='center')
Text(0.5, 0.5, 'I used sca()\nto switch to this axis')